
Understanding State, Local, & Federal Debt
January 27, 2021 - One of the topics on many investors’ minds at this time relates to the long-term cost of the tremendous amount of government spending relating to the pandemic. This is a subject worth exploring further and is the topic on which we hope to shed some light today.
The economic stimulus bills have been a lifeline to many but were financed with trillions of dollars of debt. To date, lawmakers have approved about $4 trillion in coronavirus-related stimulus spending while the Federal Reserve has injected trillions more into financial markets. This massive federal spending, meant to lessen the economic impact of the pandemic, has largely done its job. Nonetheless, and despite the obvious near-term economic benefits of this stimulus, there are longer-term consequences.
Understanding the U.S. Federal Budget
We should first understand, in a big-picture sense, the United States federal budget. According to the U.S. Department of the Treasury, federal revenues were $3.42 trillion in the fiscal year ended on September 30, 2020. Income taxes of $1.61 trillion represent almost half (47%). Compared to the prior year, income tax receipts were down year over year by $203 billion. Payroll taxes, which includes Social Security and Medicare, contributed $1.31 trillion and corporate taxes added another $212 billion. Corporate taxes are a smaller slice of the pie following the passage of the Tax Cuts and Jobs Act in December 2017. The balance of $289 billion in revenue comes from various sources, including excise taxes, estate taxes, and customs duties. The total revenues of $3.42 trillion were about $290 billion below the budgeted amount.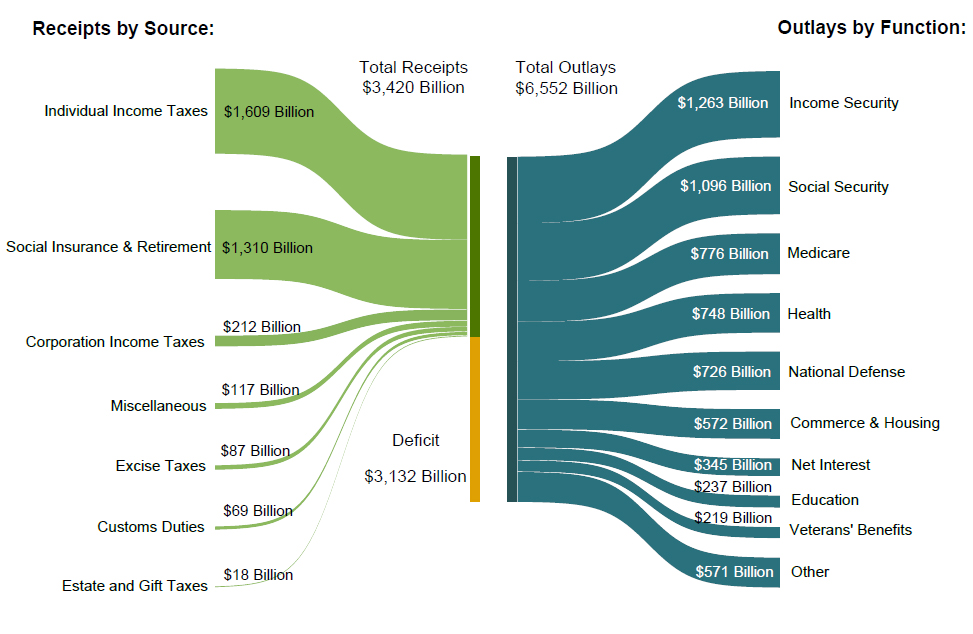 On the spending side of the equation, there are three components to government spending: mandatory, discretionary, and interest on government debt. Mandatory payments are federal benefits including Social Security, Medicare, and Medicaid. These payments are authorized by an Act of Congress and can only be changed in that same manner. Discretionary spending is the portion of the budget that Congress appropriates in the annual budgeting process. The government expenditures in the fiscal year ended September 30, 2020 were $6.55 trillion, $1.76 trillion higher than budgeted. The majority of the overages in 2020 were the result of the CARES Act and other pandemic-related fiscal . The final component of spending is the interest payments the Department of the U.S. Treasury must pay on the national debt.
Fiscal deficits are negative balances that arise whenever a government spends more money than it brings in during the fiscal year. This imbalance is not uncommon, and, in fact, since 1970, the U.S. government has had higher expenditures than revenues for all but four years (1998 – 2001). This gap between income and spending is subsequently equalized with the issuance of government debt, thereby increasing the national debt. The “budgeted” fiscal deficit for 2020 was projected at $1.08 trillion. In the end, due partly to lower revenues and mostly to higher stimulus spending, the 2020 fiscal year budget deficit was a whopping $3.13 trillion, or 16.8% of real GDP. It sounds like a huge number . . . because it is. Prior to 2020, the largest single deficit was $1.4 trillion, which was 9.3% of real GDP, in 2009. Previously, the largest deficits in dollar terms, those in the 1940s during World War II, reached as high as 27% of GDP.
Our Debt in Recent Past
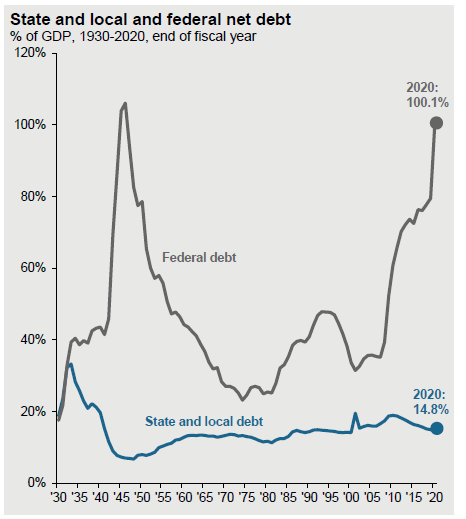
Looking back to the year 2000, our U.S. government debt outstanding was $5.6 trillion. This balance doubled by 2009 to $11.9 trillion. As of December 31, 2020, the outstanding public debt was $27.75 trillion dollars. Of that balance, $21.6 trillion is held by the public and the balance is “intergovernmental holdings,” which is basically money that the government owes to itself. At the end of 2020, debt held by the public was almost 100% of GDP. Government debt has averaged around 63% of GDP from 1940 to 2019. Based on the projected budget deficit for 2021, we are likely to soon exceed the previous peak of debt as a percent of GDP (118%) reached in 1946. That debt, driven higher by spending during World War II, was subsequently reduced over the next three decades as post-war recovery began and the debt as a percent of the economy was reduced to only 31% of GDP by 1974.
Unfortunately, there is little chance of that scenario repeating. When World War II ended 75 years ago, Social Security was in its infancy and Medicare did not yet exist. Today, Social Security and Medicare together are the largest components of the U.S. budget. As shown in the Congressional Budget Office (CBO) forecast, Social Security, Medicare, and Medicaid combined comprise 30% of the estimated $5.1 trillion in projected 2021 spending.
What Does The Future Hold?
CBO projects that if current laws governing taxes and spending generally remained unchanged, federal debt held by the public would first exceed 100 percent of gross domestic product (GDP) in 2021 and would reach 107 percent of GDP, its highest level in the nation’s history, by 2023. Without intervention, debt would continue to increase in most years thereafter, reaching 195 percent of GDP by 2050. High and rising federal debt makes the economy more vulnerable to rising interest rates and, depending on how that debt is financed, rising inflation. The growing debt burden also raises borrowing costs, slowing the growth of the economy and national income, and it increases the risk of a fiscal crisis or a gradual decline in the value of Treasury securities. 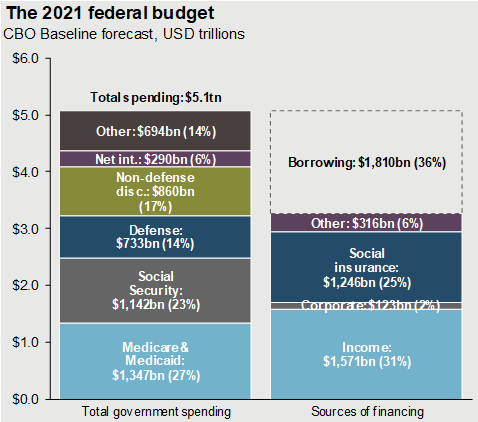
Is there no limit to what we, as a nation, can borrow? As a point of fact, there is. The “debt ceiling” is a legislated limit to the amount of debt that can be issued by the U.S. Treasury. The debt ceiling was created in 1917 and has been raised or suspended many times over the intervening 100+ years. The debt ceiling has been at the center of numerous high-profile political skirmishes and even occasional government shutdowns as the ceiling was held hostage as a bargaining chip. In August of 2019, President Trump signed a bill to suspend the debt ceiling for two years. The end result of this action is that the government will be able to borrow enough money to pay current debts and obligations until July 21, 2021. At that time, the debt ceiling will automatically be raised to reflect how much was borrowed.
There is another perspective on our current debt level. Some economists, most notably Harvard Economists Larry Summers and Jason Furman, argue that the current environment of low “real” interest rates (the interest rate minus inflation) offer an outstanding opportunity to fund long-standing needs. A Furman-Summers research study suggests that the burden of national debt is best measured by annual inflation-adjusted interest payments as a percentage of GDP and that anything under two percent should be sustainable. At present, it is well below that. In fact, the federal government is today spending less on debt service now than it was 30 years ago. Further, many contend that investments that boost growth – such as infrastructure, scientific research, education, or public health – effectively pay for themselves.
From where we sit today, in the early weeks of 2021, COVID-19 remains a threat to our economy. There are risks, too, with the addition of more stimulus and a persistent accommodative Federal Reserve policy. The chief risk is that inflation could move higher. It is no surprise that investors would find that alarming as we have not faced significant inflationary pressures in the United States in almost 40 years! In the short-term, a moderate rise in inflation may actually be welcomed. Moderate inflation has economic benefits and many economists would maintain that moderate inflation levels are necessary to drive consumption and are essential for economic growth. The Federal Reserve officially targets an average rate of 2 percent inflation as consistent with a healthy and expanding economy. Despite this, inflation has, for years, remained stubbornly below that target.
This new administration, and likely all those that follow, is faced with a problematic array of policy choices as they confront the daunting budgetary situation. Although we cannot know exactly what solutions may be employed, we are ever mindful of the potential impact that these tax and policy changes will have on our clients and the prevailing investment environment. The statistics may be alarming although it seems clear that this debt issue really comes home to roost when interest rates begin to rise and our debt service increases. Investors do not yet seem overly worried about inflation. Prices of most commodities remain far below levels from ten years ago. Prices of inflation options imply a one-in-five chance that the Consumer Price Index will rise more than 3% in each of the next five years. More immediately likely than inflation is the prospect of higher income taxes, especially for individuals in the highest tax brackets. This improves the relative attractiveness of federal tax-free municipal bonds. Also, the possibility of capital gains tax changes in future years might make realizing gains in 2021 an attractive proposition to consider. As always, we welcome conversation with you about your individual situation and how these changes might impact our approach.