
Explore This Report With These Links
- U.S. Growth Rebounds in Q1
- Fed Holds in June
- Inflation Reaccelerated in May
- Oil Markets: From Record Disruption to a Sharp Reversal
- The Labor Market Holds Steady
- Consumer Confidence and Spending: A Familiar Pattern
- Housing Market Healing
- The Business Backdrop: A Two-Speed Economy
- Tariffs and Trade: The Section 122 Cliff Approaches
- Fiscal Backdrop: War Spending Meets a $1.9 Trillion Deficit
- Eurozone and China
- Key Rates
- Market Commentary
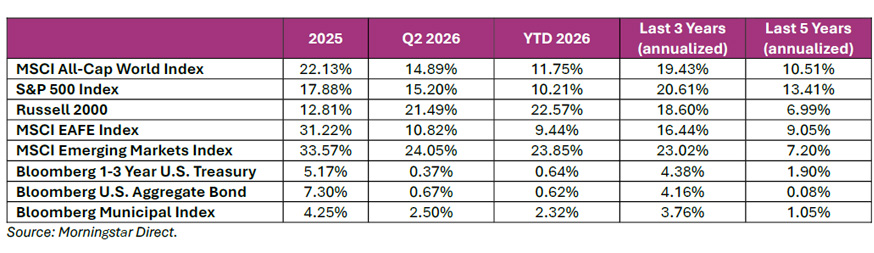
- Selected Period Returns
- Navigating Conflict-Driven Volatility
- What Could Go Right In The Second Half Of 2026?
Executive Summary
The second quarter of 2026 was defined by the economic and market consequences of the war in Iran and, more importantly, by its de-escalation. The conflict, which began on February 28, drove the largest oil supply disruption in history through April and May before a U.S.–Iran framework agreement reopened the Strait of Hormuz late in the quarter, sending oil prices sharply lower into quarter-end. If Q1 was the stagflation chapter of this story, Q2 was the resolution chapter. Inflation, predictably, accelerated through the early part of the quarter. Headline CPI rose to 4.2% year-over-year in May, the highest level since April 2023, driven almost entirely by a 23.5% year-over-year surge in energy prices and a 40.5% jump in gasoline. Core CPI, by contrast, was relatively contained at 2.9%, suggesting that the inflation shock did not meaningfully bleed into the broader price structure.
The Federal Reserve absorbed all of this in the most consequential meeting of the quarter. On June 17, in Kevin Warsh's first meeting as Chair following Jerome Powell's departure, the FOMC voted unanimously 12–0 to hold the federal funds rate at 3.50%–3.75%, dramatically shortened its policy statement, removed prior easing-bias language, and saw its dot plot flip from a projected cut to a potential hike before year-end.
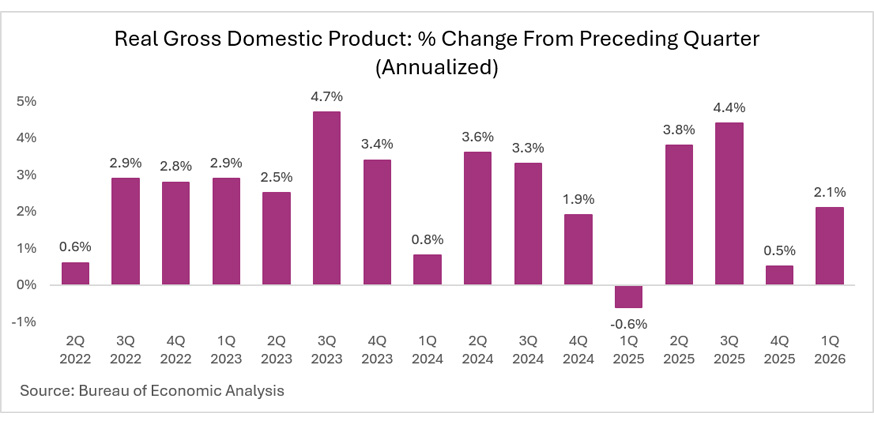
Growth proved more resilient than feared. Real Gross Domestic Product (GDP) growth in Q1 was 2.1% annualized, an acceleration from Q4 2025's 0.5% pace, though underlying consumer spending contributed just 0.5%. The labor market continues to show steady, if unspectacular, momentum, with May payrolls rising a stronger-than-expected 172,000 and the unemployment rate holding at 4.3%, where it has now sat for several months.
Markets recovered impressively from the Q1 selloff. The S&P 500 index closed the quarter up 15.2% for the quarter, fully recovering the 4.3% Q1 drawdown and adding meaningful gains beyond. Small-cap and emerging market equities outperformed, with the Russell 2000 and MSCI Emerging Markets indices gaining 21.5% and 24%, respectively. In fixed income, returns were modest, as higher income levels helped offset a slight decline in prices.
U.S. Growth Rebounds in Q1 — But the Composition Was Soft
Real GDP grew at a 2.1% annualized rate in the first quarter of 2026, a clear acceleration from Q4 2025's 0.5% pace. Underneath the headline, however, the composition of growth tells a more nuanced story. Consumer spending was revised down sharply to just 0.5%, its weakest reading in several years, driven by a marked slowdown in services demand from 1.8% to 0.5%. Gross private domestic investment rose 7.9%, with business investment in equipment surging 15.8% and intellectual property products up 13.8%, both reflecting continued capital deployment into AI infrastructure. Residential investment fell 7.8%, and non-residential structures investment declined 4.7%. Government spending rose 4.4% as activity normalized following the end of the late-2025 federal shutdown. Final sales to private domestic purchasers, a cleaner read on underlying demand, increased 1.7%.
Inflation pressures embedded in the GDP report remained elevated. The Q1 Personal Consumption Expenditure (PCE) price index increased 4.6%, and the core PCE price index excluding food and energy rose 4.4%, both reflecting the energy shock from the early stages of the Iran conflict.
Looking forward, the war-driven energy spike has begun to reverse following the Strait of Hormuz reopening, and the labor market remains stable. The economy retains the structural tailwinds we highlighted last quarter, heavy corporate investment in AI, productivity gains across services industries, and disproportionate spending strength from higher-income households, but the unusually soft consumer spend in Q1 is a reminder that the runway is narrower than a 2.1% headline would suggest.
Fed Holds in June — But the Dot Plot Flips Hawkish in Warsh's Debut
The June 17 Federal Open Market Committee (FOMC) meeting was the single most important policy event of the quarter. It was the first meeting under new Chair Kevin Warsh, who was confirmed by the Senate on May 13 in a 54–45 vote and sworn in on May 22, succeeding Jerome Powell. The Committee voted unanimously, 12–0, to maintain the target range for the federal funds rate at 3.50% to 3.75%, where it has stood since December 2025.
The decision itself was widely expected; CME FedWatch had priced a hold at roughly 97% heading into the meeting, but nearly everything else about the meeting represented a clear policy pivot. The post-meeting statement was dramatically shortened, removed prior language signaling a bias toward future cuts, and centered explicitly on inflation, describing it as "elevated relative to the Committee's 2% goal" and noting supply shocks tied to energy. Chair Warsh declared in his opening remarks that "this Committee will deliver price stability" and that "the recent past need not be prologue."
The Summary of Economic Projections was the clearest expression of the hawkish turn. The median 2026 year-end fed funds projection rose to 3.8% from 3.4% in March, flipping the dot plot from an implied cut to an implied hike, and 17 of 18 officials judged the risks to inflation to be tilted to the upside. Notably, Chairman Warsh declined to submit his own dot, citing long-standing concerns about the forecasting tool as a policy communication device, and indicated he is forming task forces to overhaul Fed operations, including communications, the dot plot, press conferences, and minutes.
The unanimous vote stands in sharp contrast to Jerome Powell's final meeting on April 29, which produced an 8–4 split, the most divided FOMC vote since 1992. For investors, the message is unambiguous: the Fed is on hold, but the next move is more likely to be a hike than a cut, and the bar for cuts has risen materially.
Inflation Reaccelerated in May — But the Energy Spike Should Peak Here
The May Consumer Price Index (CPI) report showed headline inflation rising to 4.2% year-over-year, the highest level since April 2023, up from 3.8% in April. On a monthly basis, headline CPI rose 0.5%, with the energy index accounting for over 60% of the increase.
The breakdown highlights how concentrated the inflation pressure remains in energy. The energy index rose 3.9% in May after gaining 3.8% in April and 10.9% in March and is now up 23.5% year-over-year. Gasoline prices rose 7.0% in May alone and are up 40.5% from a year ago, while fuel oil is up 58.9% over the same period. Airline fares, which respond quickly to jet fuel prices, are up 26.7% year-over-year.
By contrast, core CPI, excluding food and energy, rose just 0.2% in May and is up 2.9% year-over-year, only modestly above the prior month's 2.8% reading. Core commodities prices fell 0.1%, with declines in household furnishings, new vehicles, and medical care goods, evidence that tariffs and broader pricing pressures are not currently spilling into goods inflation in a sustained way.
Importantly, May likely marks the peak for energy-driven inflation. Following the U.S.–Iran framework agreement and the reopening of the Strait of Hormuz late in the quarter, gasoline prices have already fallen roughly $0.30 per gallon from their late-May highs, and oil futures suggest continued declines through the second half of 2026. The next CPI report, scheduled for July 14, will be the first opportunity to see those declines flow through the data.
Oil Markets: From Record Disruption to a Sharp Reversal
Oil markets in Q2 traced one of the most dramatic round trips in history. The closure of the Strait of Hormuz triggered the largest supply disruption ever recorded, with global oil supply falling by an estimated 10.1 million barrels per day (mb/d) in March and forecast to decline 6.9 mb/d year-over-year in Q2, the largest quarterly drop since the COVID-19 pandemic. Brent crude rose roughly 65% during the initial shock to record its largest monthly gain ever, and International Energy Agency member countries, who are primarily developed oil-importing countries, unanimously agreed to release 400 million barrels from emergency reserves on March 11.
The mid-quarter ceasefire framework reversed much of that move. After trading in the $85–$110 range for much of April and May, West Texas Intermediate (WTI) fell sharply in June as the U.S. granted Iran a 60-day license to sell oil on global markets and shipping flows began to normalize. As of quarter end, WTI was trading at $69.83 per barrel, down roughly 38% from the early Q2 high of approximately $112. WTI has effectively round-tripped back to pre-escalation levels, a remarkable reversal that, sustained, materially reduces the inflation pressure embedded in Q3 data.
The spillover damage outside oil markets, however, will be slower to unwind. Refining capacity in the Persian Gulf region took meaningful hits, and supply recovery lags suggest even a genuine reopening needs roughly three months before diesel and jet fuel markets normalize fully.
The Labor Market Holds Steady
The May employment report was a clear upside surprise. Nonfarm payrolls rose 172,000, more than double the 80,000 consensus, and the unemployment rate held at 4.3%, where it has now sat in a narrow 4.3% to 4.5% range since July 2025. Prior months were also revised meaningfully higher: April was revised up by 64,000 to 179,000, and March was revised up by 29,000 to 214,000.
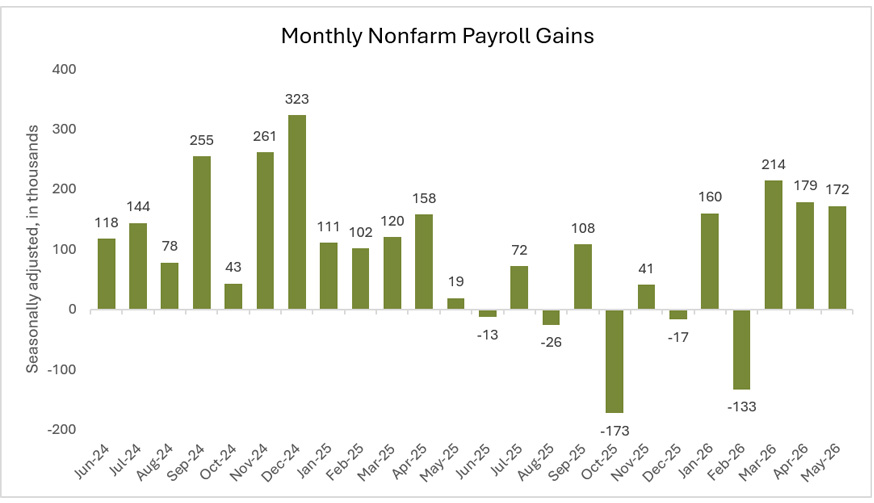
Job gains were also broader than in recent months. Leisure and hospitality led with 70,000 jobs—well above its 14,000 monthly average and likely reflecting hiring tied to the World Cup. Local government added 55,000, health care added 35,000, and social assistance added 12,000. Financial activities was the notable laggard, shedding 22,000 jobs.
Wage growth has continued to moderate. Average hourly earnings rose 0.3% in May and are up 3.4% over the past year, meaningful in absolute terms, but now running below headline inflation. That gap matters: from the Fed's perspective, it confirms that wage pressures are not the primary driver of the current inflation pulse, supporting Chair Warsh's framing of the inflation problem as supply-driven. From the consumer's perspective, however, it means real purchasing power continues to erode in the categories like fuel, electricity, and groceries, where the squeeze is most visible.
Consumer Confidence and Spending: A Familiar Pattern
The pattern we identified in Q1, weakening sentiment colliding with surprisingly resilient spending concentrated at the top of the income distribution, extended into Q2 and arguably intensified. Consumer confidence hit historic lows mid-quarter, with the University of Michigan Sentiment Index falling to an all-time low of 44.8 in May before rebounding 10.5% to 49.5 in June as gas prices moderated and long-run inflation expectations eased from 3.9% to 3.3%. Higher gasoline prices and ongoing geopolitical headlines weighed disproportionately on lower- and middle-income households throughout the quarter, though the late-quarter reversal in energy prices has begun to stabilize forward expectations. With the top 10% of U.S. households accounting for roughly 45%–50% of total consumer spending, aggregate demand has remained more durable than headline sentiment would suggest, but it has also become more concentrated, and therefore more sensitive to wealth effects from equity markets and home values.
Housing Market Healing
U.S. housing affordability is showing gradual signs of improvement after the sharp post-pandemic surge in home prices and rents. Home prices have largely plateaued since 2022, rent growth has slowed significantly, mortgage rates have eased from their 2023 highs, and rising household incomes have helped reduce affordability pressures. At the same time, robust housing construction combined with slower population growth is improving the balance between supply and demand, which should help keep home prices and rents contained. Despite these improvements, affordability remains a challenge for many potential buyers, with the median age of a first-time homebuyer rising to a record 40 years old, highlighting how difficult it remains for younger households to enter the housing market. Overall, easing housing pressures could provide a meaningful tailwind for lower inflation and a more stable economic environment over the coming year.
The Business Backdrop: A Two-Speed Economy
Business conditions strengthened meaningfully in Q2 even as small business sentiment softened, a bifurcation that has become the defining feature of this cycle. The ISM Manufacturing PMI rose to 54.0 in May, its fifth straight expansionary reading and strongest since May 2022, with New Orders surging to 56.8 and S&P Global's Flash June Manufacturing PMI extending to 55.7. Hyperscaler AI capex continues to provide a structural floor under business investment, manufacturing orders, and S&P 500 earnings, which FactSet now expects to grow 23.1% in Q2, a second consecutive quarter above 20%.
The offset comes from Main Street: the NFIB Small Business Optimism Index fell to 95.3 in May, its lowest since October 2024, with only 16% of owners planning capital outlays in the next 3–6 months, the weakest reading since 2009, and the Uncertainty Index at 91 versus a historical norm of 68. In short, large-cap, AI-exposed firms are accelerating; smaller, cost-sensitive employers are still absorbing the energy, tariff, and policy shocks of the past two quarters.
Tariffs and Trade: The Section 122 Cliff Approaches
The tariff landscape remains shaped by the February Supreme Court ruling that invalidated the broad set of IEEPA-based tariffs the administration imposed in 2025. The interim replacement, Section 122 of the Trade Act of 1974 tariffs initially set at 10% and rising to 15% on select countries, has a statutory time limit and is scheduled to expire in July, leaving the path forward uncertain. Section 232 tariffs on steel, aluminum, and related products and Section 301 tariffs on Chinese imports remain in place and unaffected by the ruling. The tariff refund process for the more than $165–$170 billion in invalidated IEEPA duties remains in development, with implementation paused pending administrative system buildout. From a macro perspective, the looming Section 122 expiration is the most material near-term trade variable to watch as Q3 unfolds.
Fiscal Backdrop: War Spending Meets a $1.9 Trillion Deficit
The fiscal trajectory has deteriorated further. The Congressional Budget Office's baseline FY2026 deficit projection of roughly $1.9 trillion did not include any conflict-related appropriations, and Pentagon briefings have indicated that operations in the Middle East cost more than $10 billion in the first week of the war alone. The Department of Defense's expected supplemental funding request, potentially in the range of $100–$200 billion, will add directly to the deficit. With the war's active phase appearing to wind down following the Hormuz reopening, the question now shifts toward replenishment of depleted munitions stockpiles and the longer-term defense posture. Higher deficits, rising interest costs, and persistent inflation continue to argue for a higher-for-longer term premium on the long end of the curve.
Eurozone and China
The Eurozone remains the most exposed major economy to a Middle East oil shock and has been the slowest to recover. The ECB has continued to flag higher energy prices as a source of elevated inflation and weaker growth, and the central bank's ability to ease policy has been constrained by the same dynamics complicating the Fed's task. China's exposure—roughly 45%–50% of its oil imports come from Gulf supply—is the largest among major economies, but the impact has been cushioned by strategic reserves, diversified sourcing toward Russia and Central Asia, and reduced oil intensity from electrification. Both regions should see meaningful relief in Q3 as oil prices normalize, though the timing of demand recovery remains uncertain.
Key Rates
Market Commentary
The second quarter of 2026 was a study in resilience. After absorbing the worst of the energy shock in March, equity markets spent much of Q2 rebuilding, with the S&P 500 reaching an all-time high in early June before a late-quarter pullback driven by a global semiconductor selloff that began in Korean memory chips and spread into U.S. AI names. The S&P 500 closed the quarter up 15.2% and 10.2% year-to-date.
The recovery was led by the same large-cap, AI-linked names that lagged in Q1, as investor focus shifted from energy-driven inflation risk back toward earnings, productivity, and AI capital expenditure plans. Capital spending tied to AI continues to be a defining feature of the cycle; the broader corporate commitment to AI infrastructure is roughly $700 billion for 2026 alone, providing a structural floor under technology earnings even through periods of valuation stress. The technology sector rose by 28% in Q2 and is up 16.8% for the year to date. Other leading sectors included Industrials (14.8%), Real Estate (11.8%), and Health Care (10.2%). Energy was the laggard for the quarter, losing 13.4%, but remains up 20% for the year to date.
For the past three years, the “Magnificent 7” stocks—Apple, Amazon, Alphabet, Meta, Microsoft, Nvidia, and Tesla—have been a primary driver of the S&P 500’s strong returns. That trend has shifted in 2026, however, as market leadership has broadened beyond mega-cap technology. Through mid-year, only Alphabet has outperformed the broader market, while the Magnificent 7 as a group has posted a modest decline of 3%. This rotation reflects investors’ growing interest in a wider range of sectors and companies as earnings growth and market performance become less concentrated.
Small caps and emerging markets were the clear quarter-over-quarter standouts. The Russell 2000, which had been the first major U.S. index to enter correction territory in Q1, rebounded sharply on optimism around domestic growth, gaining 21.6% for the quarter and 22.6% so far in 2026. This return marks the best first-half performance since 1991. Emerging markets posted the strongest absolute returns among major equity benchmarks, supported by continued strength in Asian AI-exposed markets and a softer dollar. The MSCI Emerging Markets index added 24% in the quarter, taking YTD gains above 23.8%.
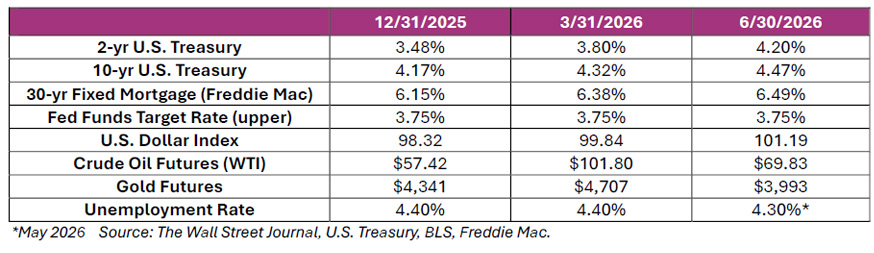
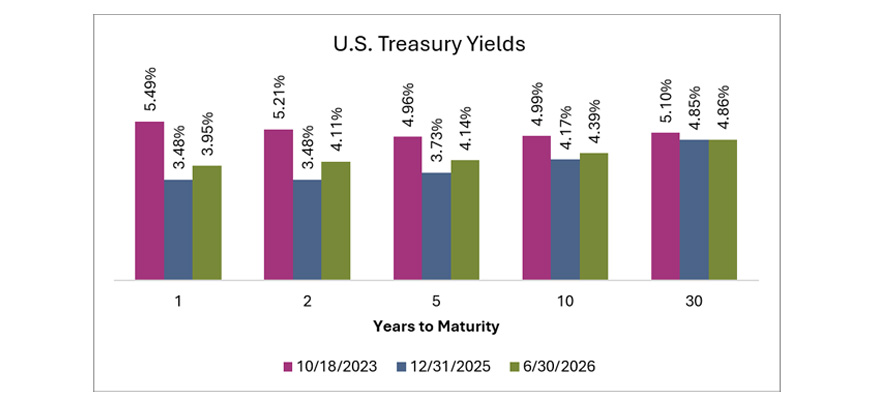 Bond markets reflected the Fed's hawkish hold and the persistence of supply-driven inflation. The 10-year Treasury yield ended Q1 at 4.32% and ended Q2 at 4.47%, while the 2-year yield rose from 3.80% to 4.2%, reflecting the dot plot's pivot toward a potential hike rather than a cut by year-end. The curve has flattened modestly versus Q1 levels, consistent with the market reading the Fed's posture as inflation-credible but the long-run growth outlook as moderating. The Bloomberg U.S. Aggregate Bond index posted a .67% Q2 return despite a modest yield increase across the curve, while the Bloomberg 1-3 Year U.S. Treasury index was up .37%.
Selected Period Returns
Navigating Conflict-Driven Volatility — A Familiar Pattern Plays Out
Q2 offered an unusually clean test of the historical pattern we wrote about last quarter. The early-quarter energy shock and inflation surge looked, for a brief period, like a potential stagflation episode. By mid-quarter, diplomatic progress and the reopening of Hormuz had begun to reverse the oil spike, and by late June, equity markets had not only stabilized but reached new all-time highs. The lessons from prior episodes, that markets typically discount geopolitical disruptions faster than fundamentals change, and that equity drawdowns driven by external shocks are usually shorter than they feel in the moment, held once again.
That said, the quarter also reinforced the importance of distinguishing between resolution and reversal. The Iran conflict is not fully resolved; the framework agreement has a 60-day window, and the underlying tensions that produced the closure of Hormuz have not gone away. Section 122 tariffs face a July expiration. The Fed has clearly signaled that it would rather hike than cut. Inflation, while peaking, is still well above target.
What Could Go Right In The Second Half Of 2026?
The constructive case for the second half of 2026 has actually strengthened during Q2. Oil prices have already reversed sharply, which should drive headline inflation meaningfully lower into the back half of the year and reopen, over time, the door to Fed easing if labor markets soften. Corporate AI capital expenditure continues at unprecedented levels, providing a structural growth floor independent of the policy cycle. The labor market has proven steadier than expected, with May payrolls and the unemployment rate confirming a "low-hire, low-fire" equilibrium rather than a deteriorating one. Higher-income consumer spending remains a durable source of demand, and the Q1 GDP reaffirms that the underlying economy is more resilient than some data may suggest.
As always, this is not a market environment for retreat. It is a market environment for staying focused on quality, diversification, and the structural drivers of long-term growth as the cycle continues to normalize. Through periods of conflict and resolution alike, we remain committed to guiding you with clarity, discipline, and perspective.
First Business Bank – Ready When You Are.
Updated: 7/2/2026