
Explore This Report With These Links
- Surging Imports Cloud First-Quarter Results
- Federal Reserve Holds Rates Steady Amid Continued Economic Uncertainty
- Key Inflation Rate Holds Steady at 2.4%
- Consumers More Upbeat
- U.S. Budget Issues Continue
- Geopolitical Events Take Center Stage
- Labor Market Holds Firm
- U.S. Dollar Weakens
- Mixed Signals in U.S. Business Activity
- Key National Housing Data
- Global Growth at a Below-Trend Rate
- Market Commentary
- One Big Beautiful Bill Winds Through The System
- Portfolio Repositioning
- Navigating Volatility as a Long-Term Investor
Executive Summary
As we reflect on the second quarter of 2025, one theme stands out: resilience through discipline. Amid a backdrop of tariff-driven volatility, geopolitical uncertainty, and shifting monetary policy, investors who remained grounded in long-term strategy were rewarded. At First Business Bank, we believe that moments of disruption—like the sharp April sell-off—can offer some of the most compelling opportunities for portfolio repositioning. Our proprietary systems, FOLIObalancer™ and FOLIObuilder™, were purpose-built for these environments, enabling clients to navigate turbulence with confidence and clarity. This quarter’s developments reaffirm the importance of staying invested, maintaining diversification, and relying on a disciplined framework, not headlines, to guide decisions.
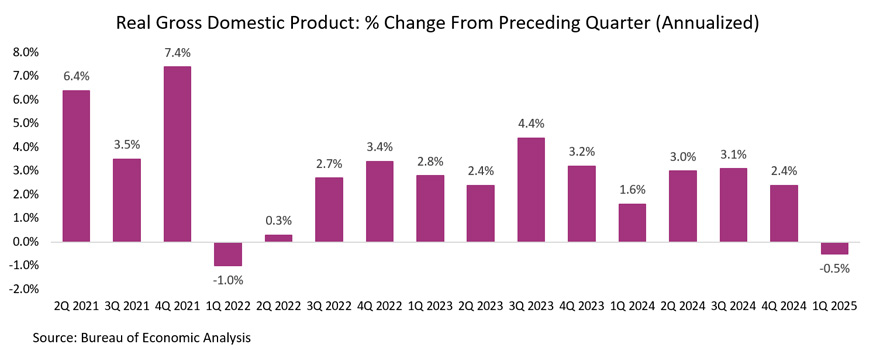
In the first quarter of 2025, the U.S. economy contracted, with real GDP decreasing at an annual rate of 0.5%. The final estimate showed a sharper decline than earlier estimates due to downward revisions in consumer spending and exports. Pre-tariff imports, which count as a subtraction from GDP, overshadowed gains in inventories, business investment, and consumer spending.
In monetary policy, the Federal Reserve held interest rates steady in June at a target range of 4.25% to 4.50%, marking the fourth consecutive meeting without a change. The Fed is closely monitoring the inflationary and growth implications of recent tariffs. Current market expectations point to two rate cuts by year-end, bringing the target range down to 3.75% to 4.00%.
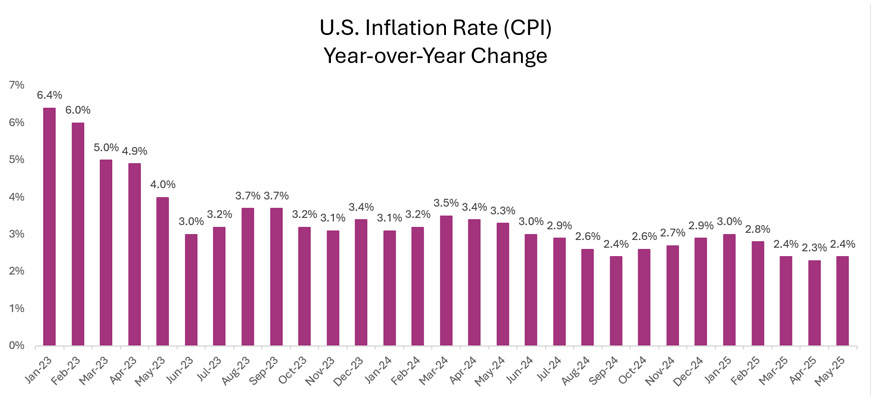
On the inflation front, consumer prices rose at an annual rate of 2.4% in May, marking the first monthly increase in four months. April’s 2.3% rate was the lowest since February 2021. According to the Personal Consumption Expenditures (PCE) index, the Fed’s preferred inflation gauge, core inflation (excluding food and energy) eased to 2.5% in April, the lowest since March 2021.
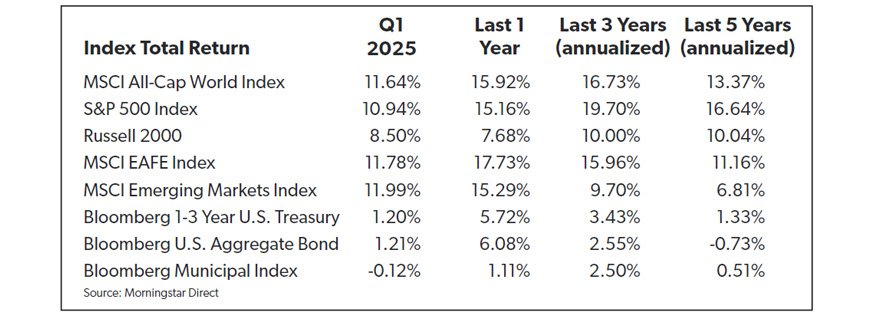
Financial markets overcame jitters caused by tariffs and uncertainty around global growth to close the quarter at an all-time high. After being down by 15% in early April, the S&P 500 rebounded strongly in the quarter as the stance on tariffs softened and is up 6.20% for the year. The Russell 2000 small-cap index recovered significantly in the quarter and sits down only 1.80% for the year to date. Developed and emerging international equities are booming with returns, due partially to a declining U.S. dollar of 19.50% and 15.30% respectively, for the year to date.
Surging Imports Cloud First Quarter Results
The U.S. economy experienced an annualized contraction of 0.5% in the first quarter of 2025, marking the first quarterly GDP decline in three years. Tariffs are expected to slow employment growth and increase prices. The first-quarter GDP data reflected anticipatory actions rather than the actual effects of tariffs. Imports of goods and services rose by 38% as businesses and consumers stockpiled goods in preparation for higher prices following tariff announcements. This surge in imports was evident in the change in private inventory, which contributed 2.6% to Q1 GDP. Consumer spending grew by 0.5%, the slowest rate since Q1 2019, while federal government spending decreased by 4.6%, the largest drop since Q1 2022. Conversely, fixed investment increased by 7.6%, the most significant gain since mid-2023.
In the first quarter of 2025, GDP was influenced by corporate actions taken in response to early tariffs and in anticipation of more substantial tariffs. In the second quarter, trade policy from the administration appears to be coming together, as the White House negotiates deals with various nations, with some announced tariffs being paused or delayed.
Late in June, the U.S. and China confirmed the outline of a trade framework that seeks to allow rare earth exports and easing of tech trade restrictions. The U.S. has also finalized deals with the UK, Vietnam, and is reportedly close to an agreement with India. The Trump administration has announced 25% tariffs on imports from Japan and South Korea effective August 1. A total of 14 nations have received tariff letters with rates ranging from 25% to 40%. Uncertainty persists regarding progress with major trade partners, particularly the EU, as the extended August 1 deadline for the postponement of reciprocal tariffs approaches. This uncertainty is likely to impact GDP growth in the coming quarters.
In contrast to the first quarter, second-quarter GDP is likely to benefit from the reverse dynamic. The April advance trade report showed a sharp 19.8% drop in goods imports, which will provide a significant boost to net exports. New orders for manufactured goods in the U.S. jumped by 16.4% over the prior month, the sharpest increase since July 2014. As a result of recent data, the Atlanta Fed’s GDPNow model currently projects a 2.9% annualized increase in real GDP for Q2. While fluctuations in trade have skewed headline numbers, underlying indicators suggest that the economy continues to expand at a solid pace.
Federal Reserve Holds Rates Steady Amid Continued Economic Uncertainty
The Federal Reserve has maintained its target rate at 4.25% to 4.5% for the fourth consecutive meeting, continuing its cautious approach following three rate cuts in late 2024. This sustained pause indicates that policymakers remain vigilant about persistent – and potentially resurgent – inflation while keeping an eye on broader economic conditions.
A significant source of uncertainty is the tariff initiatives, which could apply upward pressure on prices and affect GDP growth. While consumer price inflation has eased considerably, from peaks above 9.0% in 2022 to below 3%, progress toward the Fed’s 2.0% target has recently stalled.
Despite these concerns, the labor market remains strong, with unemployment rates at historically low levels. However, GDP entered negative territory last quarter, primarily due to an anomalous import figure. Given the robust employment landscape, the Fed does not perceive an immediate necessity to lower rates at this time.
During the June meeting, the Fed also released updated projections. Officials now anticipate economic growth between 1.4% and 1.8% through 2027, a slight downgrade from earlier forecasts. Inflation is projected to gradually ease to 2.0% by 2027, though it is expected to rise to 3.1% later this year. Over the next two years, the federal funds rate is expected to decline to a range of 3.25%-3.55%, implying a real interest rate of approximately 1.25%.
Federal Reserve Chair Jerome Powell stated that policymakers are “well positioned to wait” before making further rate adjustments and advised that the “dot plot” should be interpreted cautiously given the highly uncertain macroeconomic environment. A notable development from the Federal Reserve’s June meeting is the increase in members advocating against rate cuts this year, rising from four to seven individuals opposing rate reductions.
Key Inflation Rate Holds Steady at 2.4%
Consumer prices rose just 2.4% annually last month, according to the Bureau of Labor Statistics. That was less than economists had expected, and only slightly higher than the 2.3% rate in April, which was the U.S. economy’s lowest inflation since February 2021. Both all-items and core inflation remain doggedly above the Fed’s 2% target level. On the good news front, two stubborn inflation series, transportation services and shelter, have declined meaningfully. These typically sticky categories have kept overall inflation elevated even as goods inflation has backed down in the past year.
The Bureau of Labor Statistics reported in May that both producer and consumer prices increased by just 0.1% on a monthly basis, suggesting minimal upward pressure from the tariffs. While tariffs have not yet significantly impacted inflation data, evidence indicates that as inventories are depleted, prices are rising. A May 2025 survey by the Federal Reserve Bank of New York reveals that a majority of firms have transferred at least part of the tariff-related cost burden to their customers. Notably, nearly one-third of manufacturers and approximately 45% of service-sector firms reported fully offsetting these costs through price increases. For investors, this implies that companies with strong brand equity or limited competition may be better positioned to maintain margins, whereas those in more commoditized sectors could experience pressure on profitability.
The PCE price index, the measure of inflation most closely watched by the Federal Reserve, ticked slightly higher in May, but did not show a big upswing in prices caused by tariffs. Core PCE — which strips out volatile items like food and gas prices — rose to 2.7% in May compared with 2.6% in April. That was the lowest reading since March 2021.
Consumers More Upbeat
Consumers in early June demonstrated a noticeable reduction in pessimism regarding the economy and potential inflation surges, as progress appeared feasible in the global trade war, according to a recently released University of Michigan survey.
The university’s closely monitored Surveys of Consumers indicated broad-based recoveries from previous negative sentiments, while respondents significantly reduced their short-term inflation outlook. These developments aligned with a softening in posture surrounding tariffs. Following the April 2 reciprocal tariff announcement, President Trump has moderated his stance, instituting a 90-day negotiation period that seems to be yielding progress.
Despite improvement, it is important to note that all sentiment indexes remain substantially below their year-ago levels as consumers continue to express concerns about the impact of tariffs on prices and other geopolitical issues. Regarding inflation, the one-year outlook saw a significant decline, reaching levels not seen since 1981. The one-year estimate dropped to 5%, a decrease of 1.6%, while the five-year outlook slightly decreased to 4.0%, showing a 0.2% drop.
U.S. Budget Issues Continue
The fiscal position of the U.S. government further deteriorated in May, as the Treasury Department reported a monthly deficit exceeding $316 billion, which brings the year-to-date total to $1.36 trillion—a 14% increase compared to the same period last year. This follows a temporary surplus in April due to seasonal tax receipts.
A significant contributor to the widening deficit is the escalating interest costs on the national debt, now at $36.2 trillion. Interest payments alone amounted to $92 billion in May, making it the third-largest federal expense following Medicare and Social Security. To date, debt service for this fiscal year has reached $776 billion, with projections potentially exceeding $1.2 trillion by year-end.
Despite a growing deficit, tax revenues rose by 13% in May and 6% year over year. Government spending increased by 2% for the month and 8% from last year. Tariff revenues also saw notable gains. Gross customs duties reached $26 billion in May due to new tariffs on steel, aluminum, automobiles, and goods from China, Mexico, and Canada. For the fiscal year to date, tariffs have generated $86 billion, up 59% over 2024, with $37.8 billion collected in April and May.
Tariff collections totaled $60 billion through June, a 21% increase from the same period in 2024, driven by tariffs largely on Chinese imports. U.S. imports from China dropped to $24 billion in April, the lowest since 2010 (excluding early pandemic months). Imports from Canada, Mexico, and other countries also fell. The impact of these tariffs on inflation, corporate margins, and market sentiment remains a concern for investors.
Geopolitical Events Take Center Stage
Our current environment is dominated by territorial disputes and nuclear rearmament concerns, threatening global stability. Investors are closely monitoring the implications of ongoing conflicts in the Middle East and recent actions concerning Iranian nuclear facilities. Iran's reaction plays a pivotal role; it has cautioned that there would be repercussions for U.S. strikes on its key nuclear sites and stated that it "reserves all options," while initially showing restraint. One potential outcome could be the closure of the Strait of Hormuz, through which approximately 20% of the world's oil supply transits. This action could impede Iran's ability to export oil, rendering it counterproductive. Additionally, Iran might target other nations' oil and gas infrastructure, possibly provoking retaliatory measures.
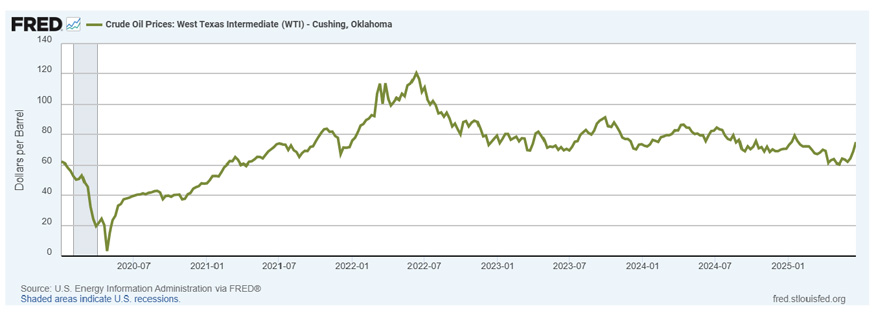
The conflict in the Middle East caused West Texas Intermediate (WTI) crude oil prices to rise from $57 at the beginning of May to a high of $75 in mid-June. However, by the end of the month, concerns abated and WTI closed the quarter at $65. Iran's oil production stands at 3.2 million barrels per day (BPD), constituting about 3.25% of global production. Furthermore, the Strait of Hormuz, through which over 20 million BPD of oil flows, remains the world's most critical oil chokepoint. Any military activity or blockade here could severely disrupt global supply chains. Experts express concern about the potential targeting of crucial regional oil infrastructure. Several companies operating in the Middle East have reported withdrawing foreign staff from regional facilities, potentially hampering operations.
Energy significantly contributed to inflation in 2022 and 2023 as prices escalated following Russia's invasion of Ukraine, disrupting global oil and gas supplies. Crude oil prices, based on WTI, surged to $123.64 in mid-2022, leading to sharp increases in headline inflation, particularly in Europe and parts of Asia where energy comprises a larger share of consumer spending. By 2024, energy prices began to stabilize or decline, reducing their direct contribution to inflation. Thus far this year, weaker energy prices have been a consistent source of disinflation amidst elevated tariff uncertainty. For instance, the 3.5% year-over-year decline in energy prices in May helped reduce CPI inflation by 0.25%.
The United States' exposure to oil shocks has decreased significantly compared to the past. In 1977, during the lead-up to the Iranian Revolution that initiated the second Oil Crisis, the U.S. had net imports of approximately 3.1 billion barrels of petroleum annually and refined products or 14 barrels per person. This per-capita figure remained unchanged as recently as 2003 during the Second Gulf War. The U.S. also depended heavily on natural gas imports. Presently, the U.S. is the largest producer of oil and gas globally, accounting for about 20% of global output in 2024. U.S. oil imports peaked around 2005 at over 10 million BPD but have since declined to approximately 1.9 million BPD as of 2025, the lowest level since 1971. This reduction results from increased domestic oil production, higher exports of refined petroleum products, and improved energy efficiency.
Labor Market Holds Firm
The labor market has demonstrated considerable resilience amidst policy uncertainty. Key factors contributing to the strength of the job market include companies' adoption of a "no-hire, no-fire" approach due to recent labor market tightness, robust consumer spending, and strong performance in sectors such as defense and health care. The June report indicated an addition of 147,000 jobs, with the unemployment rate slightly lower at 4.1%.
A detailed analysis of the data highlights underlying strength. Firstly, job growth for the previous two months was revised upward by a total of 15,000. Although job creation remains firm, the average monthly job growth in the first five months of 2025 is lower at 130,000 compared to 168,000 for the entirety of last year. Secondly, the unemployment rate eased to 4.1% and the number of unemployed individuals decreased by 222,000 to 7.015 million.
Other recent data suggests a potentially weakening labor market. Initial unemployment claims have risen and continuing jobless claims have reached a recent cycle high, based on their four-week moving average. The National Federation of Independent Businesses' monthly jobs survey showed a net 12% of small businesses planning to hire within the next three months, one of the lowest readings in the past decade. The Conference Board's consumer confidence survey for May revealed the smallest positive gap between "jobs plentiful" and "jobs hard to get" observed since last September.
The Job Openings and Labor Turnover Survey (JOLTS) reported that job openings in the U.S. increased to 7.8 million in May. Separations, quits, and layoffs were little changed from the prior month. With 7 million people seeking work and 7.8 million job openings, the labor picture appears much more balanced than in recent years. Furthermore, due to declining net immigration, even slower payroll growth is unlikely to result in a rapidly increasing unemployment rate.
U.S. Dollar Weakens
The U.S. dollar continues to play a significant role in global trade and finance, though its dominance is experiencing challenges. The utilization of the dollar for sanctions has introduced a perceived risk for countries with substantial dollar reserves. Consequently, central banks in China, India, Turkey, and Brazil are seeking to diversify their portfolios.
The Association of Southeast Asian Nations (ASEAN) has recently committed to increasing the use of local currencies in trade and investment as part of its Economic Community Strategic Plan for 2026 to 2030. This plan aims to mitigate exchange rate fluctuation impacts by promoting local currency settlements and enhancing regional payment connectivity.
While this trend is more noticeable in Asia, there is a broader global reduction in reliance on the U.S. dollar. The share of the dollar in global foreign exchange reserves decreased from over 70% in 2000 to 57.8% in 2024. Additionally, the dollar experienced a notable sell-off in April due to uncertainty surrounding U.S. policymaking. Since the beginning of the year, the dollar index has declined by 10.7%, benefiting holders of foreign investments.
Mixed Signals In U.S. Business Activity
The ISM Manufacturing PMI in the U.S. dropped to 48.5 in May, marking three months of contraction and the sharpest decline since November 2024, due to economic uncertainty and volatile trade policies. Industrial Production grew by 0.6% year on year, the smallest increase this year. Signaling a potential turnaround, new orders for manufactured goods surged by 16.4% in May 2025, the highest increase since July 2014. An increase in spending on transportation equipment led to the surge and orders for capital goods also rose significantly.
The service sector showed some weakness with the ISM Services PMI falling to 49.9 in May 2025 from 51.6 in April. It indicated a modest contraction in the services sector, the first decline since June of the prior year.
According to a recent survey released by Wisconsin Manufacturers and Commerce (WMC), 68% of Wisconsin business leaders’ rate the local economy as “moderate,” while 20% rate it as “strong.” When asked about their top concerns, 36% pointed to the national economy as the most pressing issue, followed by 13% who cited global economic conditions. Other significant concerns included rising health care costs and challenges related to availability. However, the survey revealed a positive trend: employers are finding it somewhat easier to hire workers. In fact, only 52% of employers reported difficulty in filling positions, the lowest percentage recorded in the past decade.
The Kansas City Fed’s Manufacturing Production Index rose to 5 in June 2026 from -10 in May, the highest level since August 2023, signaling a rebound in factory activity.
Key National Housing Data
As of June 2025, active housing inventory in the U.S. has increased by 27.7% compared to the previous year. This represents the 83rd consecutive week of annual inventory growth and is the highest percentage increase since the housing bubble burst in 2006. However, this increase should be considered in the context of the extremely low base following the post-pandemic housing shortage normalization. The inventory is still approximately 300,000 units below May 2019 levels. Factors such as softer labor data and elevated rates are expected to continue balancing supply and demand.
Homeowners have been holding off selling homes for a number of reasons, many of which are tied to financial dynamics. A large majority of homeowners locked in ultra-low mortgage rates during the pandemic. Selling would mean replacing those low rates with new mortgages at 6-7% or higher. Home prices remain historically high, making it difficult for sellers to find affordable replacement homes. Some of the increase has come from new listings, a measure of sellers putting homes up for sale, rose 5.2% year over year.
As of May 2025, the average American household will have to pay 44.6% of their income—much more than the suggested 30%—to purchase a median-priced home, according to a Realtor.com Affordability Report. Elevated interest rates have driven the ratio of mortgage payments to median household income to its highest level in nearly 35 years, making home ownership increasingly unattainable. The median age of first-time homebuyers has steadily climbed — from 33 in 2020 to a record 38 in 2024, according to the National Association of Realtors.
Global Growth At A Below-Trend Rate
Global trade tensions have lessened since early April, following the U.S. administration's tariff reductions. Ongoing negotiations with various partners have made progress in several areas. Economic activity has remained steady in most regions, and there is some cautious optimism regarding the outlook.
Growth is expected to slow across major markets during the remainder of the year but is unlikely to drop significantly. As long as trade tensions continue to ease, the global economy can grow amidst uncertainties. The global economy is projected to expand at 2.8% in 2025 and 3.0% in 2026, down from 3.3% in 2024 and below the long-term average of 3.8%, due to factors such as inflation, high interest rates, and trade tensions. Advanced economies are expected to experience modest growth, with the U.S. leading at 1.8%, while emerging markets are anticipated to grow faster, led by India at 6.2% and China at 4.0%. India's growth is driven by population increases and infrastructure demand, while China's growth stems from productivity improvements and rising consumer spending.
Eurozone consumer price inflation decreased to 1.9% year on year in May 2025, down from 2.2% in April and below market expectations of 2.0%, according to a preliminary estimate. This marks the first time inflation has fallen below the European Central Bank’s 2.0% target since September 2024, reinforcing expectations for a 25-basis point rate cut later this week and suggesting the possibility of additional cuts. A significant factor in the deceleration was a sharp slowdown in services inflation, which dropped to 3.2% from 4.0% in April, its lowest level since March 2022.
China's economy has been resilient in the first half of the year, aided by early exports. However, trade tensions and higher tariffs will affect external demand. Although tensions have eased, tariffs on Chinese imports to the U.S. will remain higher than at the start of the year.
Key Rates
Market Commentary
The bull market that began in October 2022 is now in its third year and has seen the S&P 500 rise nearly 80%, despite factors such as high inflation, economic uncertainty, a U.S. Treasury credit rating downgrade, a contentious election, and new tariffs and trade wars. Market volatility was observed in the quarter, particularly in April following the announcement of reciprocal tariffs. The S&P 500 experienced a decline of 21.5% on April 7, 2025, from its February 19 peak on an intra-day basis. This dip did not qualify as a bear market because it was not sustained. Subsequently, President Trump declared a 90-day pause on the implementation of reciprocal tariffs and granted exemptions for certain goods, including smartphones and other consumer electronics containing semiconductors. By the end of April, the S&P recovered much of its losses, concluding the month down by just 0.7% overall. The balance of the quarter was strongly positive with the S&P 500 finishing at a new all-time high, returning 10.94% for the quarter. The year-to-date results for the index are positive at 6.2%.
The small-cap market, as represented by the Russell 2000 index, has staged a significant recovery from an almost 21% negative as of April 8 to a decline of only 1.8% year to date.
The tech sector, the largest in the S&P 500 at a weighting of 31.6%, surged higher in the quarter, up 23%. NVIDIA and Microsoft, the two largest holdings in the S&P 500, contributed 435 basis points to the quarter’s 11.6% return. The communications sector was up by 18% and industrials rose by 12%. Energy and health care declined, down 8% and 7.8%, respectively.
The Magnificent Seven, which includes NVIDIA, Microsoft, Alphabet, Apple, Amazon, Meta, and Tesla, tumbled nearly 25% to start the quarter. With the exception of Apple, which is negative by 8% for the quarter, all rebounded strongly and, as a group, are up 3% for the year to date.
Global markets have experienced significant growth, despite ongoing trade tensions, driven by attractive valuations, a weaker dollar, and fiscal tailwinds. The MSCI Europe, Australia, and Far East Index (EAFE) has increased by 8% in local currency terms so far in 2025. For U.S. investors, this return is even higher at 19.5%, due to the depreciation of the dollar. Similarly, emerging international markets have yielded returns of 15.3% year to date. These robust returns from international investments highlight the importance and positive impact of maintaining a globally diversified portfolio.
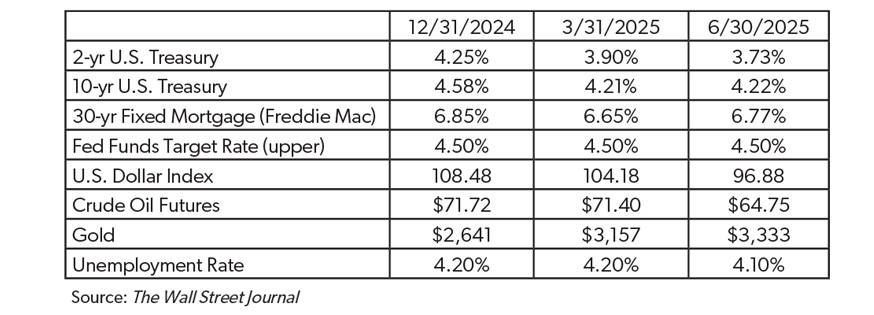
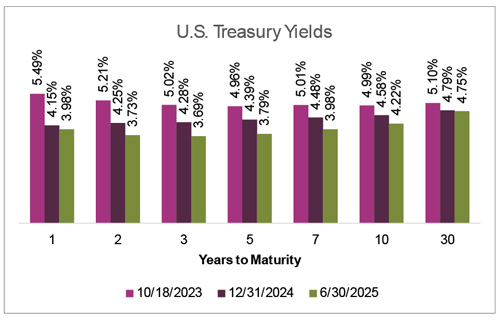 In the fixed-income markets, the second quarter of 2025 saw notable shifts along the Treasury curve. The yield on the 2-year U.S. Treasury note declined from 3.90% to 3.74%, reflecting a decrease in short-term rates, possibly due to changing inflation expectations and economic policies. In contrast, the 10-year Treasury yield experienced a modest increase of 3 basis points, ending the quarter at 4.24%, indicating a mixed sentiment on long-term economic prospects. At the long end of the curve, the 30-year Treasury yield rose by 21 basis points, pricing in potential higher inflation and increased fiscal deficits, signaling market concerns over long-term fiscal sustainability. For the year to date, the 2-year yield is down 0.52%, the 10-year declined by 0.36%, and the 30-year is lower by .04%. Higher income levels and modest yield declines produced a positive year-to-date return of 4% for the Bloomberg Aggregate Bond index.
One Big Beautiful Bill Finds its Way Through The System
Congress met the self-imposed deadline of July 4 to pass the massive spending and tax bill that includes many signature policies of President Trump’s second term, allowing President Trump to sign the bill on Independence Day. The so-called One Big Beautiful Bill (OBBB) includes many provisions that will affect the economy for years to come. Key among them is the extension of personal tax cuts from the 2017 Tax Cuts and Jobs Act. The administration plans to offset revenue losses with cuts to health care and nutritional programs, environmental tax credit reforms, and tariff revenues. However, the Congressional Budget Office estimates the OBBB will increase the federal deficit by ~$3.4 trillion over the next decade.
There was a flurry of changes to the 887-page bill to achieve slim passage in both the House and the Senate, including various tax reductions, spending changes, and an increased debt limit.
Major provisions include:
- Extensions and enhancements of the 2017 Tax Cuts and Jobs Act
- Increased State and Local Taxes (SALT) cap to $40,400, reduced for higher incomes
- Exemption of tips and overtime from income tax
- Increased standard deduction and changes to itemized deductions
- Adjusted Child Tax Credit eligibility and phase-out thresholds
- Basic estate and gift tax exemption increased to $15 million
- Bonus depreciation reset to 100% for qualified property
- Permanent and increased Qualified Business Income (QBI) deduction for pass-through entities to 23%
We will continue to monitor and interpret the legislation, providing analysis and updates to protect your interests.
Portfolio Repositioning
During March and April, elevated market volatility created a timely opportunity for portfolio rebalancing, particularly within non-taxable accounts. In early March, we proactively reduced equity exposure to align with our neutral allocation targets, based on broader market conditions. Then, following a significant market decline after April 8—driven specifically by tariff announcements—we rebalanced again using First Business Bank’s proprietary FOLIObalancer rebalancing system. Purpose-built to respond to volatility and optimize portfolio positioning, FOLIObalancer enabled us to act decisively during this period of dislocation. This disciplined approach proved especially effective, delivering meaningfully enhanced risk-adjusted returns compared to a traditional buy-and-hold strategy. Looking ahead to mid-2026, we believe April 2025 may be remembered as one of the most compelling rebalancing opportunities of the past decade—on par with March 2020 and the pandemic-era market trough—and a clear demonstration of the value of our FOLIObalancer system in navigating turbulent markets.
Navigating Volatility As A Long-Term Investor
For investors navigating policy uncertainty, heightened tensions in the Middle East add another layer of complexity to decision-making. These geopolitical risks can trigger market volatility, reinforcing the importance of maintaining a long-term investment perspective.
At First Business Bank, our investment philosophy is rooted in strategic discipline. We guide clients using our Ten-Year Capital Markets outlook, which serves as a foundation for asset allocation decisions and helps investors stay focused on long-term goals rather than short-term market noise. Supporting this approach is our proprietary FOLIObuilder asset allocation optimization system, designed to align portfolios with long-term risk and return expectations, even in turbulent conditions.
Maintaining a consistent investment strategy during uncertain times is essential. Rather than reacting to market swings, investors are encouraged to ensure their portfolios remain well-diversified across asset classes. Diversification across equities, fixed income, and alternative investments helps mitigate risk and enhance return potential. A thoughtfully diversified portfolio provides a buffer against volatility, helping manage the impact of unforeseen events while positioning for future growth.
Regular portfolio reviews with our experienced professionals—guided by our long-term outlook and powered by FOLIObuilder—ensure your investment strategy remains on track. Reach out to our team today to confirm your portfolio is well-positioned to thrive in uncertain times. Your financial success is our priority.
Updated: 7/8/2025