


Second Quarter 2026
This report outlines key bank performance trends and strategic recommendations to help your bank capitalize on the current economic environment.
Second Quarter vs First Quarter Banking Trends*:
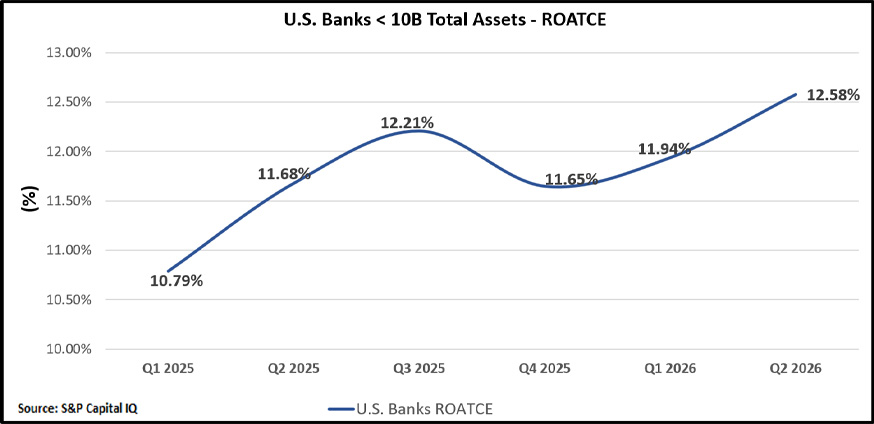
Balance sheet growth slowed for the last two quarters while bank earnings remained strong as pre-provision net revenue improved and credit metrics were stable. Some notable trends are summarized below:
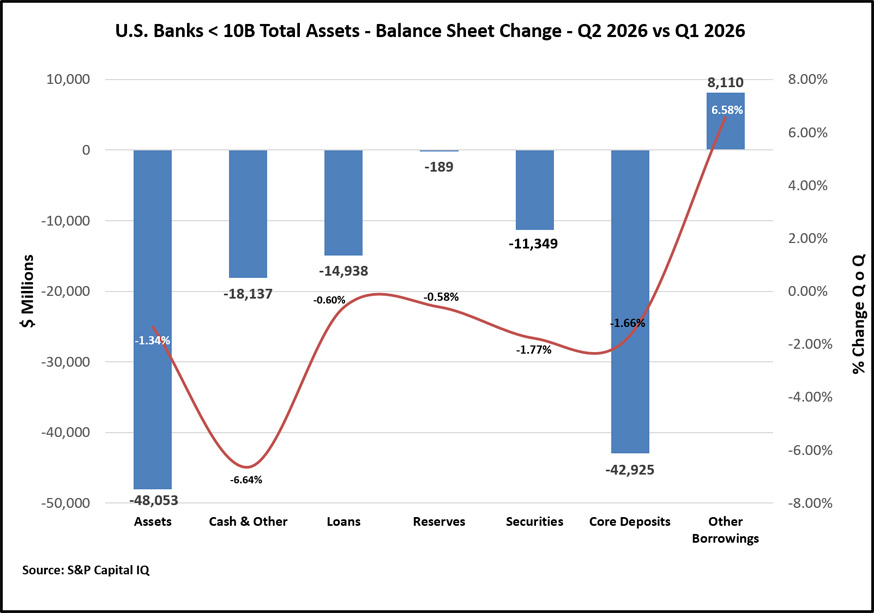
- Balance sheet growth moderated. Core deposits declined 6.6%, annualized, offsetting a decrease in asset balances. Loans and securities declined 2.4% and 7.1%, respectively. Banks utilized wholesale funding to partially offset the decline in core deposits.
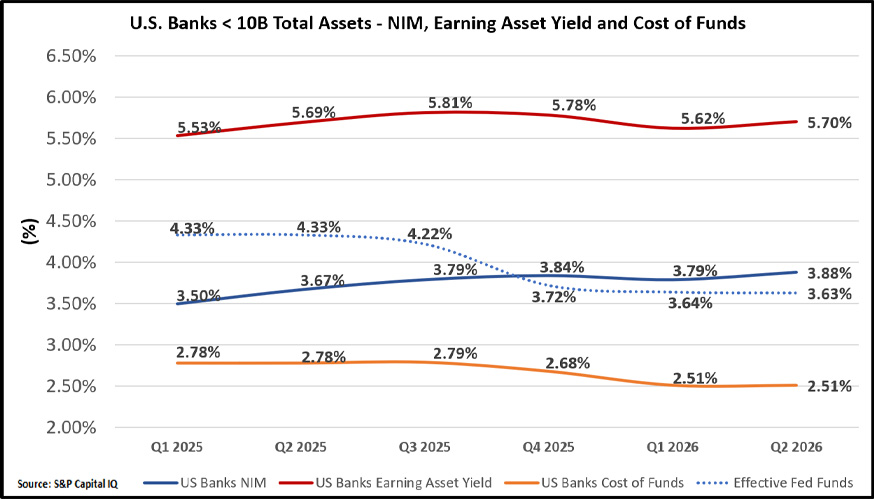
- NIM rebounded. Following a decline in Q1, NIM expanded 9 bps to 3.88%. The expansion was due to an increase in the yield on earning assets as the cost of funds remained flat at 2.51%. Cost of funds may be at an inflection point as competitive pressure builds for banks to raise deposit rates.
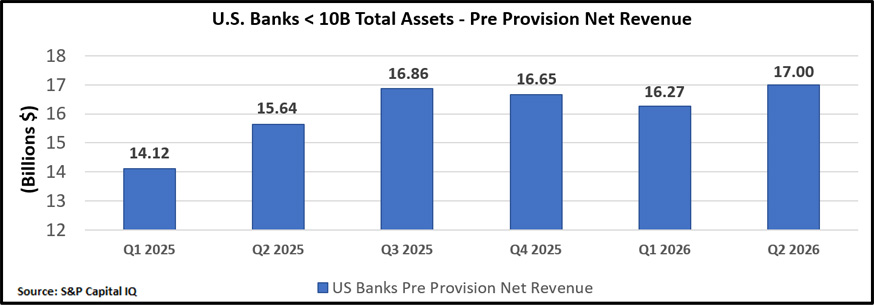
- Operating earnings improved. Pre-provision net revenue strengthened in the quarter, increasing 4.5%. Top-line revenue increased 1.4%, driven by increases in net interest income and fee income, and a decline in operating expenses.
- Credit metrics remained solid. NPA and NCO ratios were 0.75% and 0.26%, respectively, continuing to show resiliency in the quarter. Loan loss provisioning declined 0.6% and loan loss reserves remained stable at 1.29%.
- Regulatory update. The regulatory environment continued its focus on simplification for community banks, modernization of capital and AML frameworks, and stronger governance expectations around emerging technologies such as AI. In April, the Federal Reserve, FDIC, and OCC finalized changes to the Community Bank Leverage Ratio framework intended to simplify capital requirements for qualifying community banks. The changes are designed to reduce burden while maintaining safety and soundness standards.
Bank Strategies - Remainder of 2026 and Beyond:
Our bank strategies are designed to improve your NIM to target level performance and build a greater level of NIM stability by creating a neutral interest rate sensitivity position on your balance sheet.
In our Strategies in the Spotlight segment, we address two topics, which we believe are key to improving performance: 1) Readdressing the repricing gap and 2) current investment portfolio and hedging opportunities.
Behavioral and Structural Repricing Gap Analysis: Two Perspectives, One Balance Sheet:
Repricing gap analysis remains one of the most effective tools for evaluating a bank’s interest rate risk position, providing insight into mismatches between variable and fixed rate instruments along the maturity timeline. By measuring how assets and liabilities reprice over time, gap analysis helps management identify potential earnings pressure, assess balance sheet sensitivity, and support strategic decision-making. Repricing gap analysis can provide valuable insight into a bank’s risk profile and future performance. We will explore two variations of repricing gap – behavioral and structural.
- Behavior Repricing Gap Analysis
- Behavioral repricing gap analysis estimates future balance sheet repricing based on expected client behavior and management assumptions. Because it incorporates factors such as deposit repricing characteristics and asset prepayment activity, behavioral analysis is frequently used within interest rate risk modeling. However, the results are heavily dependent on model assumptions, and actual client behavior, which is rarely linear, particularly during periods of changing market conditions or heightened competition. Benefits of behavioral repricing gap analysis include the following:
- Reflects expected client behavior and management actions
- Incorporates non-maturity deposit assumptions
- Supports earnings simulation and interest rate risk modeling
- Provides insight into potential performance across varying rate environments
- Behavioral repricing gap analysis estimates future balance sheet repricing based on expected client behavior and management assumptions. Because it incorporates factors such as deposit repricing characteristics and asset prepayment activity, behavioral analysis is frequently used within interest rate risk modeling. However, the results are heavily dependent on model assumptions, and actual client behavior, which is rarely linear, particularly during periods of changing market conditions or heightened competition. Benefits of behavioral repricing gap analysis include the following:
- Structural Repricing Gap Analysis
- Structural repricing gap analysis focuses on contractual repricing dates and management-controlled repricing opportunities. By reducing reliance on model assumptions, structural gap analysis provides a transparent view of the balance sheet’s underlying repricing characteristics and risk exposure. Benefits of structural repricing gap analysis include the following:
- Provides a straightforward view of contractual repricing exposure
- Highlights asset and liability repricing mismatches
- Improves transparency around balance sheet positioning
- Supports funding, liquidity, and balance sheet strategy discussions
- Structural repricing gap analysis focuses on contractual repricing dates and management-controlled repricing opportunities. By reducing reliance on model assumptions, structural gap analysis provides a transparent view of the balance sheet’s underlying repricing characteristics and risk exposure. Benefits of structural repricing gap analysis include the following:
- Behavioral and structural repricing gap analysis provide different, equally valuable perspectives on interest rate risk. Behavioral gap analysis helps estimate what may reprice based on expected client behavior, while structural analysis helps management understand what can reprice based on contractual characteristics. Together, these complementary views can enhance ALCO discussions, strengthen risk management practices, and provide a more complete understanding of balance sheet positioning across changing rate environments.
- Simply put, structural gap analysis helps management understand what can happen, while behavioral gap analysis helps estimate what may happen. Because behavioral results depend on assumptions and actual client behavior is rarely linear, reviewing both perspectives together can provide a more informed framework for evaluating interest rate risk and developing effective balance sheet strategies.
Investment Portfolio and Hedging Strategies:
- Purchase considerations. The curve has steepened further in the quarter providing opportunity to extend duration of the investment portfolio in duration protection investment securities. Longer maturity tax exempt municipal bonds have cheapened providing spread over Treasury yields.
- Restructuring opportunities. We continue to recommend a quarterly review of the securities portfolio for repositioning. The steepening of the curve is providing opportunity to sell lower yielding short duration bonds and reinvesting into duration protection securities or loans with a loss earn back period less than one year and adding higher yielding bonds to the portfolio.
- Hedging opportunities. There are a variety of hedging tools available to mitigate interest rate risk and create a more neutral balance sheet. These may include back-to-back swaps, restructuring pay-fixed/receive float swaps, buying 15-to-20 year municipals and swapping to float, cash flow hedges to fund the balance sheet, which carries an added benefit of reducing funding costs, and caps & floors.
Other ALM Strategy Considerations:
- Wholesale funding strategies. Management should utilize multiple funding tools, such as FHLB advances, brokered deposits, and deposit intermediaries, to supplement core deposit growth.
- These instruments should be used interchangeably comparing best rate and term. Additionally, utilizing a favorable swap curve to structure a cash flow borrowing swap can reduce funding costs 25+ bps over FHLB advances and brokered deposits.
- Be sure to set internal limits for wholesale funding, perhaps based on a percentage of total funding sources or as a percentage of capital.
- Deposit Pricing Discipline. Banks need to maintain a strong discipline around deposit pricing, especially during a shift in the rate cycle. Here are a few considerations for your deposit committee as you make decisions to adjust deposit pricing:
- Always consider the other side of the balance sheet. How are loan yields forecasted to change over the next few months? Is there any loan repricing benefit to factor into your deposit pricing decisions? Do your deposit betas align with loan betas?
- Understand the degree of rate sensitivity between variable rate loans and non-maturity deposits. A mismatch in this immediate repricing gap bucket may influence your pricing decisions.
- Weigh the need for deposits to fund loan growth. How does your pricing align with competitors? How sticky are your deposits?
- Exception pricing must be closely monitored. Set parameters for your treasury management team to follow in setting rate and clients eligible for a premium rate. Such rates should have an upper limit that falls below the best wholesale funding rate.
The Fed funds rate remains on hold for now with ongoing volatility overseas, inflationary pressures and a slowdown in the labor market. In this environment, we anticipate NIM expansion to slow in the coming quarters as banks compete more aggressively for deposits to support loan growth.
*Source: S&P Capital IQ, US Banks < $10B
Date: 8/25/2026