

Investment products are not insured by the FDIC, are not deposits, and may lose value.
Navigating the Next Decade: Understanding Our Ten-Year Capital Market Assumptions
As markets continue to evolve and adapt to changing economic conditions, investors seek clarity on positioning their portfolios for the years ahead. In this analysis, Matt Rice, CFA, CAIA, First Business Bank's Chief Investment Officer, presents our Ten-Year Capital Market Assumptions for 2026-2035, providing a comprehensive roadmap for long-term investors with detailed insights into expected returns across asset classes. While short-term market movements often capture headlines, these forward-looking projections help our clients maintain perspective and make informed decisions aligned with their long-term investment goals.
- Executive Summary
- Inflation Outlook: A Key Building Block
- Fixed Income Projections
- Equity Market Outlook
- Alternative Investments
- Investment Implications
Executive Summary
First Business Bank presents our capital market assumptions for the next decade. As demonstrated in our overview scatter plot, our forecasts span three main categories:
- Fixed income investments (green) ranging from cash to bank loans
- Equity categories (purple) covering domestic and international markets
- Alternative investments (orange) providing additional diversification opportunities
Inflation Outlook: A Key Building Block
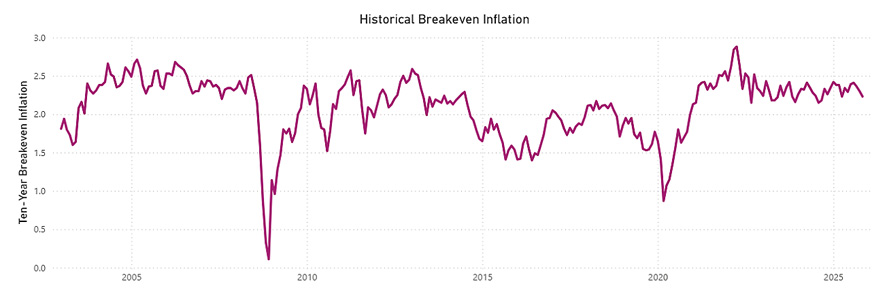
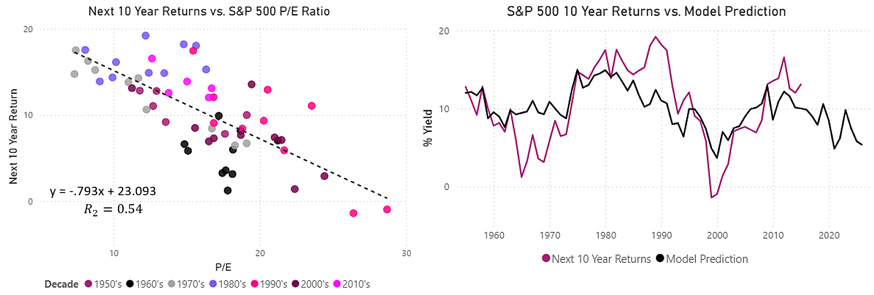
Our inflation forecast serves as a fundamental building block for all capital market assumptions. The difference between the 10-year nominal Treasury yield (4.02%) and 10-year TIPS yield (1.79%) suggests a market-implied inflation expectation of 2.23% over the next decade. This "breakeven inflation rate" methodology has proven reliable historically, with exceptions during market stress periods like the 2008 financial crisis and early 2020 pandemic.
Fixed Income Projections
Cash and Short-Term Investments
Cash currently yields 3.88%, but we expect this yield to decrease over time toward our long-term inflation expectation of 2.23%. This creates a weighted average forecast of approximately 3.06% for the next decade. Historically, cash has provided returns close to a 0% real return (after inflation), and we expect this pattern to continue long-term.
Treasury Inflation-Protected Securities (TIPS)
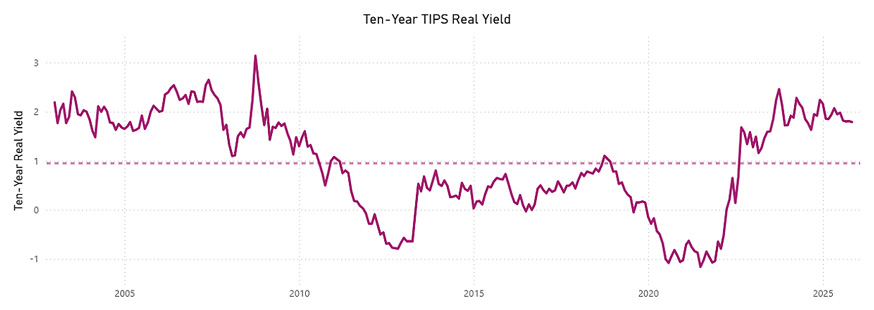
By combining our inflation forecast with the current real yield of just under 2%, we project a return of approximately 4.06%. TIPS serve as a true risk-free asset, as they provide explicit protection against inflation risk that nominal Treasuries cannot offer.
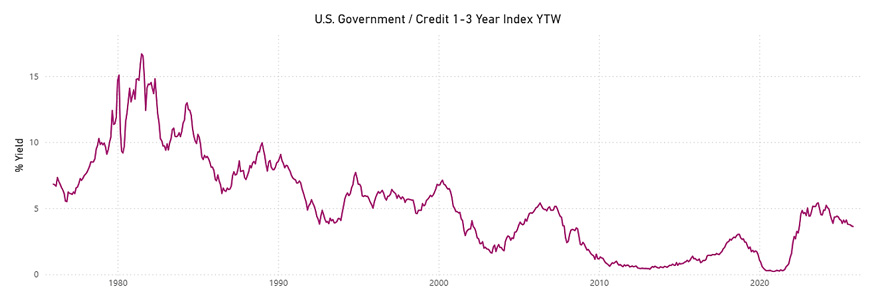
U.S. Investment Grade Intermediate Bonds
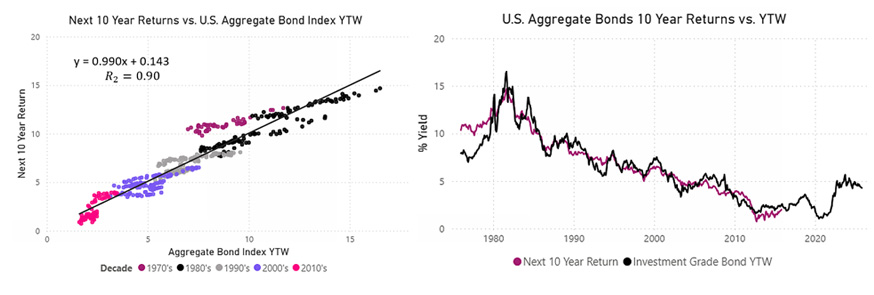
The current Bloomberg US Aggregate yield-to-worst stands at 4.27%. Our regression analysis shows an R-squared of 0.90, meaning current yields explain about 90% of returns over the subsequent decade. Based on this historically reliable relationship, we project a 4.27% return for the next ten years.
Short-Term Investment Grade Bonds
Short-term fixed income combines our cash forecast with our investment grade intermediate bond forecast in approximately a two-thirds bonds, one-third cash mix. This blend creates a portfolio with about a two-year duration, resulting in a projected return of 3.87%.
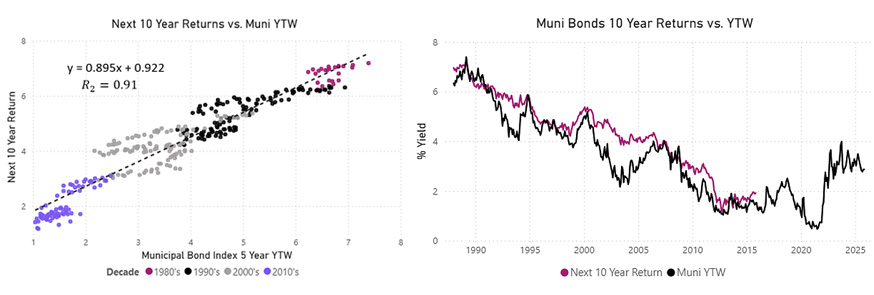
Municipal Bonds
Current yields of approximately 3% translate to a tax-equivalent yield of 4.56% for investors in the highest tax brackets. Our model shows approximately 90% accuracy in predicting returns based on starting yields. For high-yield municipals, we expect about a 4.3% return, translating to a 6.9% tax-equivalent yield.
High-Yield Municipal Bonds
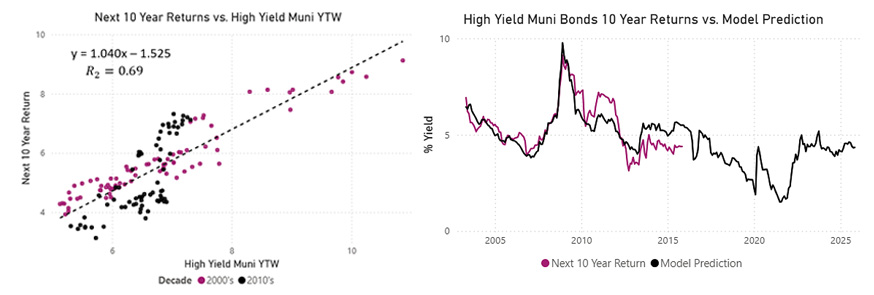
High-yield municipal bonds offer higher income potential than their investment-grade counterparts but come with additional credit risk. Based on current market conditions, the Bloomberg Municipal High Yield Index has a yield-to-worst of approximately 5.64%. Using our historical regression framework, which relates starting yields to subsequent ten-year returns, we project a long-term return of about 4.34%. For investors in the highest tax brackets, this equates to a taxable-equivalent return of approximately 6.89%.
High-Yield Bonds
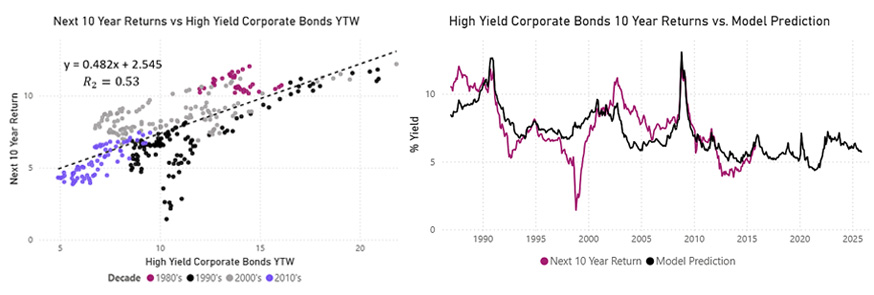
With a current yield-to-worst of 6.6%, we factor in an expected loss drag of about 0.9% from defaults. Credit spreads are currently tight relative to historical norms, suggesting more modest returns compared to previous periods when spreads were wider.
Bank Loans
Currently yielding about 8.4%, we expect yields to decline by roughly 0.8% over the next decade, consistent with our money market return expectations. After factoring in potential defaults similar to high-yield bonds, we project a return of 6.71%.
Equity Market Outlook
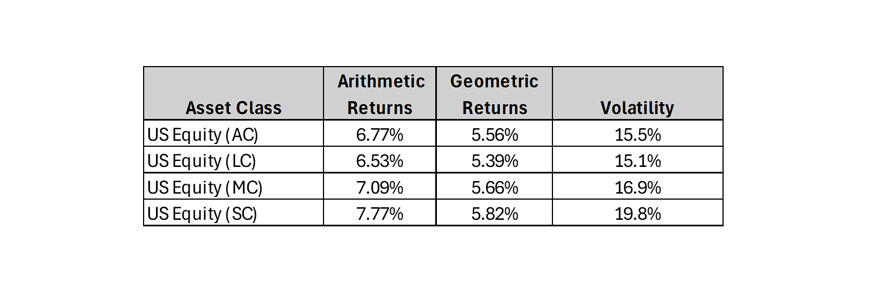
Large Cap U.S. Equity
Given current relatively high valuations, we project a return of about 5.4% over the next decade. While this is below long-term averages, it's important to note that our 10-year horizon is relatively short — over 20, 30, or 40-year periods, we expect returns closer to historical double-digit levels.
Market Cap Segments
Using Black-Litterman methodology and current market weights (70% large cap, 20% mid cap, 10% small cap), we project:
- Large Cap: 5.4%
- Mid Cap: Approximately 0.3% premium over large cap
- Small Cap: Additional premium over mid cap.
This premium structure reflects the additional volatility of smaller companies.
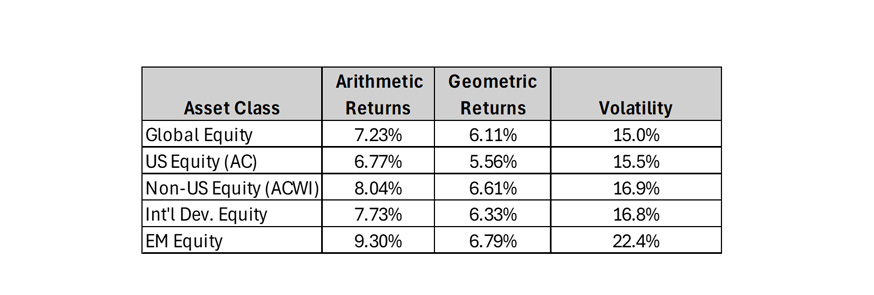
International and Emerging Markets
Global equity markets currently comprise about:
- 63% U.S. equities
- 30% international developed markets
- 7% emerging markets
We project modestly higher returns for international and emerging markets compared to U.S. equities, reflecting valuation differences and diversification benefits. However, these return expectations remain somewhat tempered relative to pure market-weight implications due to ongoing geopolitical uncertainties in Europe and Asia.
Alternative Investments
Real Estate Investment Trusts (REITs)
Our 6.3% forecast combines current dividend yields with expected rent increases matching inflation over time. This asset class currently shows attractive return potential relative to U.S. equities.
Commodity Futures
Projecting returns just under 5%, combining:
- Money market return on collateral (3.1%)
- Expected price appreciation with inflation
- No additional positive roll return assumed
Commodities serve primarily as portfolio diversifiers, particularly valuable during periods of unexpected inflation or geopolitical stress.
Liquid Alternatives
Our forecast of 5.6% is based on:
- Volatility profile matching 56% cash/44% large cap equity mix
- Base return of 34.1%
- Expected 1.5% additional return from active management
Investment Implications
While some of our 10-year forecasts appear modest compared to historical returns, it's important to understand that ten years represents a relatively short investment horizon. For longer-term investors with 20-50 year horizons, we continue to expect returns closer to historical norms, particularly in equities. These assumptions serve as building blocks for portfolio construction and financial planning, emphasizing the continued importance of diversification across asset classes and geographies.
*Disclaimer: Financial Planning, Investment Management, Trust & Estate Administration, Company Retirement Plans, Investment Portfolio Services, and Asset Liability Management solutions are NOT FDIC INSURED, NOT BANK GUARANTEED, and MAY LOSE VALUE. First Business Bank is not a tax advisor and recommends you consult your tax advisor before making tax-related investment decisions.
Published: 02/13/2026